Clara Günther · 14 October 2026
Tracking Changes in Public Access Patterns Following Major Bridge Construction Announcements
Announcements about major bridge construction projects often trigger measurable shifts in how people move through urban and regional networks, and transportation agencies have documented these adjustments through sensor networks, traffic counts, and public transit ridership data. When authorities release details on upcoming closures or lane reductions, commuters and freight operators begin exploring detours weeks or months ahead of actual work, which produces detectable changes in vehicle volumes on parallel corridors and increased ferry or rail usage in coastal areas. Studies from multiple regions show that these patterns emerge quickly after press releases and continue evolving as construction phases progress through October 2026 and beyond.
Initial Public Response to Project Announcements
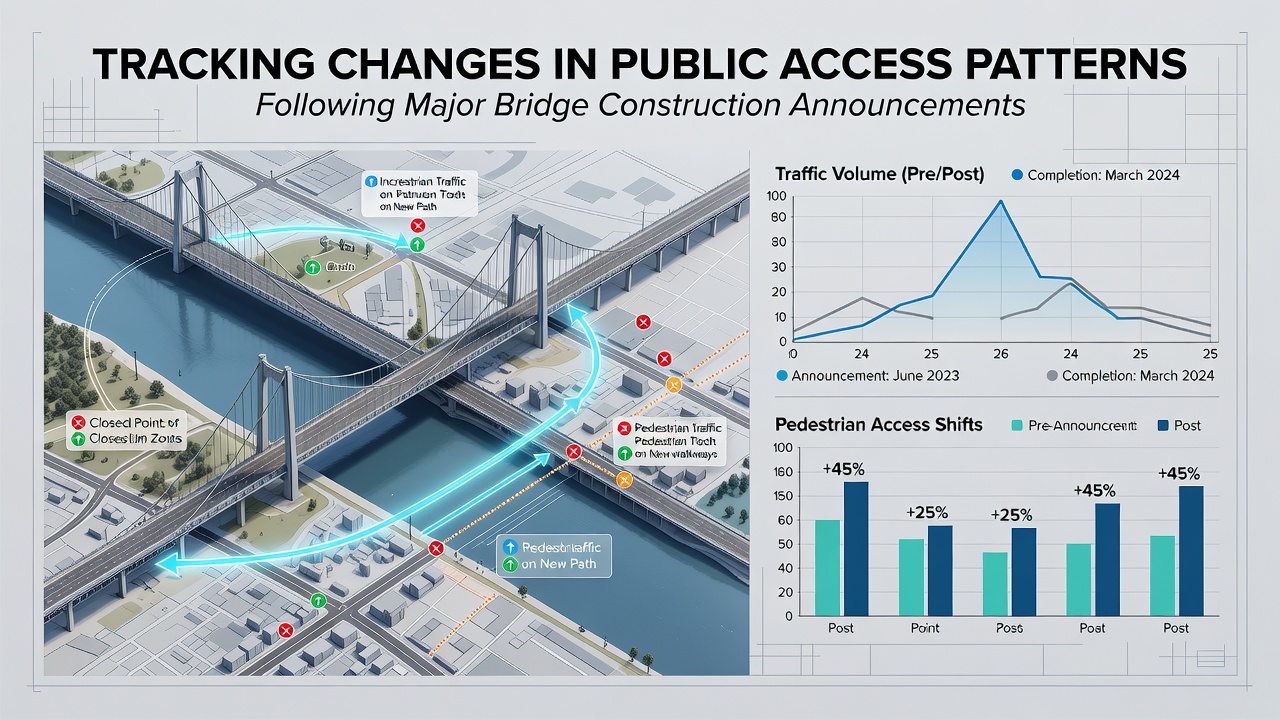
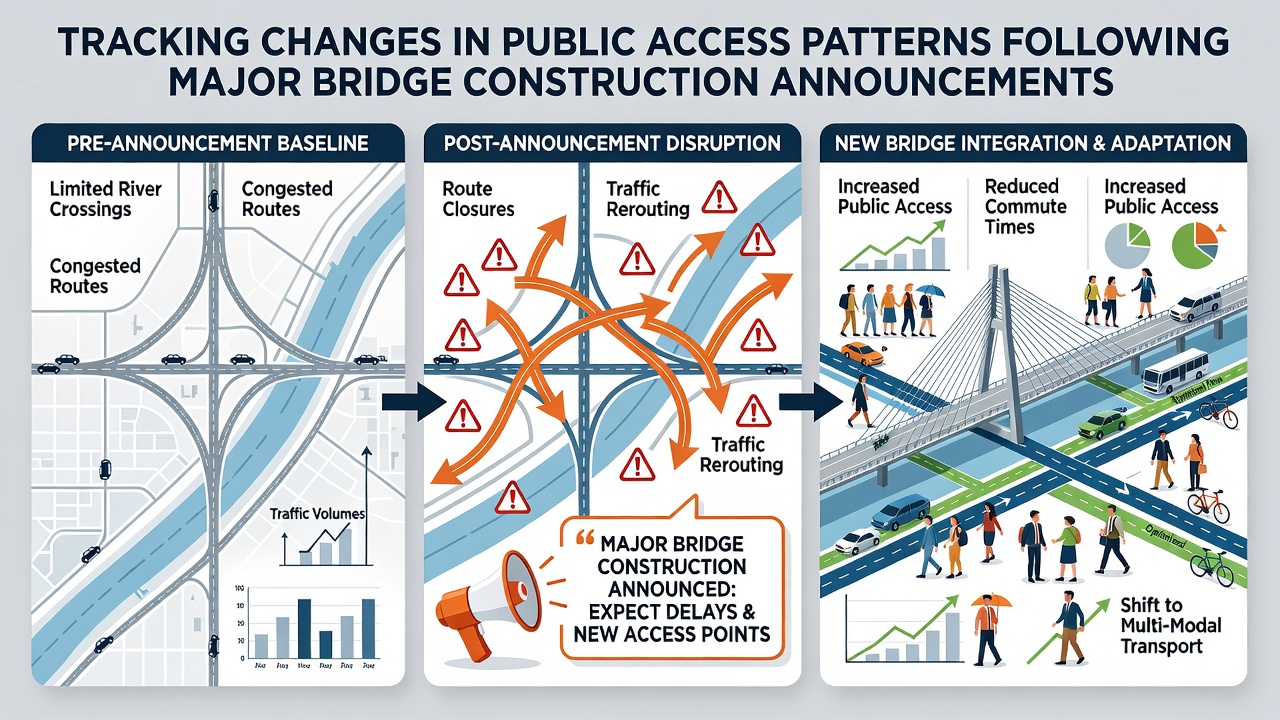
Traffic management centers record immediate spikes in queries to route-planning applications once construction timelines become public, and authorities in North America and Europe have tracked corresponding rises in alternative path selections within days of official statements. Researchers monitoring electronic toll collection systems note that drivers reroute to avoid anticipated bottlenecks, which redistributes loads across secondary roads that previously carried lighter volumes. In one documented case, a suspension bridge project in a North American port city saw daily traffic on nearby arterials increase by 18 percent in the first month following the announcement, while ferry bookings rose steadily as passengers tested new schedules.
Data Collection Methods Used by Agencies
Departments of transportation deploy inductive loop detectors, radar sensors, adn Bluetooth readers to capture real-time volume and speed data, and these tools reveal consistent trends across different project scales. When combined with mobile phone location data aggregated at the city level, analysts identify broader movement corridors that emerge only after announcements circulate through local media and public meetings. The Australian Department of Infrastructure, Transport, Regional Development, Communications and the Arts has published summaries showing how pedestrian counters near construction sites register drops in foot traffic alongside gains at distant bus stops and train stations. Such layered monitoring allows planners to distinguish between temporary adjustments and longer-term habit formation that persists after initial disruption.
Regional Variations in Access Adjustments
Urban centers with dense transit options experience different redistribution patterns than rural corridors where fewer alternatives exist, and comparative reports highlight these distinctions clearly. In densely populated European cities, announcements about bridge rehabilitation often coincide with measurable growth in cycling and e-scooter trips along protected paths, whereas North American data more frequently shows increased single-occupancy vehicle use on circumferential highways. Canadian provincial agencies have reported that winter weather combined with construction notices can accelerate mode shifts toward public transit because snow removal priorities favor main roads over detours. Observers note that these regional differences become more pronounced when project timelines extend across multiple seasons, allowing residents to experiment with various options before settling into new routines.
Longer-Term Pattern Stabilization
After the first six to twelve months, many access changes stabilize into new baselines that transportation models must incorporate for future planning, and longitudinal studies confirm this progression in multiple jurisdictions. Data released in October 2026 from several ongoing projects indicates that early spikes in alternative route usage moderate once drivers establish reliable commute times, yet overall network efficiency sometimes improves because previously underutilized roads now carry balanced loads. Freight operators frequently adopt permanent schedule adjustments to avoid peak construction windows, which in turn affects delivery patterns at warehouses and ports. Public agencies use these stabilized figures to refine signal timing and add bus priority measures that accommodate the revised flows rather than reverting to pre-announcement conditions.
Integration of Online and Physical Tracking
Search engine query volumes for phrases such as “bridge construction detours” and “alternative routes during bridge work” correlate strongly with physical traffic count changes, and transportation researchers increasingly combine both datasets to anticipate demand. Government portals that publish live construction maps receive sustained visits after announcements, and navigation app developers report higher engagement with custom route filters during those periods. This digital-physical linkage helps agencies predict when temporary capacity additions, such as reversible lanes or extra transit service, will deliver the greatest benefit. Patterns observed through October 2026 demonstrate that communities with proactive information campaigns experience smoother transitions because residents receive advance notice of both construction milestones and available alternatives.
Conclusion
Comprehensive monitoring of public access patterns after bridge construction announcements provides transportation agencies with actionable intelligence that supports safer and more efficient network operations. Sensor networks, transit statistics, and digital engagement metrics together create a detailed picture of how populations adapt, and these insights inform decisions about future infrastructure investments across continents. Continued refinement of data collection techniques will allow planners to respond more precisely to the access shifts that follow each new project announcement.